
Contents
Table of Contents
Introduction
Influencer marketing enables brands to connect authentically with potential customers like never before. It’s one of the few channels where trust, storytelling, and attention come bundled together, and where brands can grow without relying only on ads.
Yet even in 2026, many brands still feel like they’re experimenting without a clear playbook, especially on Instagram and TikTok. Campaigns can perform incredibly well one month and feel inconsistent the next. Not because influencer marketing doesn’t work, but because most brands don’t know which levers actually drive predictable results.
If you’re trying to market your product more effectively, this report is here to remove the guesswork.
No opinions. No speculation. Just outcomes.
This report analyzes over 100,000 influencers’ posts, using real collaboration results to reveal what consistently improves performance in 2026, including engagement, reach, and content efficiency across different collaboration types, creator tiers, and niches.
What this report answers
Using real post-level data, we break down questions brands care about most:
1) Which influencers actually drive the best engagement?
We break down engagement by influencer tier (nano → mega) and show what brands can realistically expect at each stage, including the difference between average vs typical performance.
2) Is gifted really better than paid… or just cheaper?
We compare Gifted vs Paid vs Affiliate campaigns across engagement and views, and explain what each model is best for, especially when your goal is predictable reach and scalable output.
3) Does niche alignment really matter, or is it just a “nice-to-have”?
We quantify the performance lift when creators are strongly aligned with the product category vs loosely matched, including major improvements in engagement consistency and reach.
4) What content formats drive the strongest results in 2026?
We break down performance by format (Reels, Carousels, Images) and show what consistently produces the best mix of:
- engagement
- comments
- repeatable performance (not just outliers)
This report is designed to help brands answer one strategic question:
How do you build an influencer program that performs consistently, and scales with confidence in 2026?
Key Findings
Based on over 100,000 influencers' posts, this report highlights the patterns behind what works in influencer marketing in 2026, and what scales most predictably.
- Smaller creators drive the highest engagementNano creators lead engagement (2.61% avg ER), followed by Micro (1.68%), with engagement declining as creators scale.
- Gifted and Paid perform similarly on engagement Gifted (2.01% ER) and Paid (2.00% ER) deliver nearly identical engagement, proving payment doesn’t automatically increase ER.
- Paid collaborations scale reach more consistently Paid campaigns generate over 2× higher typical views (1,765 vs 800), making Paid a stronger lever for predictable distribution.
- Same-brand comparisons confirm the Paid advantage on reach Within brands that ran both models, Paid achieves higher typical views (1,575 vs 777) while engagement stays similar.
- Niche alignment is a major performance multiplier Aligned campaigns drive higher engagement (2.12% vs 1.94%) and ~77% higher average views (14,630 vs 8,285).
- Carousels are the most consistent engagement format Carousels lead engagement (2.48% ER) and deliver stronger typical interaction than Reels, which have higher volatility.
Section 1: Influencer marketing works, but most brands still don’t run it like a system.
1.1 Market reality: influencer marketing works, but many brands still lack a system
Influencer marketing has never been more powerful. Brands can reach highly specific audiences through creators who feel more trusted than ads, more human than traditional marketing, and often more persuasive than brand-owned content.
And yet, many brands still feel like influencer marketing is unpredictable.
Not because the channel doesn’t work, but because performance is shaped by a few controllable factors that are often treated as “creative luck,” such as:
- creator tier selection (nano vs micro vs macro)
- niche alignment (fit between creator content and product category)
- collaboration model choice (Gifted vs Paid vs Affiliate)
- content format decisions (Reels vs Carousels vs Images)
Most brands focus on the visible metrics, likes, views, follower counts, without understanding what actually drives consistency.
This report is designed to fix that.
It breaks influencer marketing down into the specific levers that reliably improve performance in 2026, so brands can scale with more confidence.
1.2 Dataset overview & credibility
This report is built on outcomes, not opinions.
We analyzed over 100,000 influencer’ posts to compare performance across:
- influencer tiers (nano → mega)
- collaboration types (Gifted vs Paid vs Affiliate)
- niche alignment (aligned vs misaligned partnerships)
- content formats (Reels, Carousels, Images)
This allows us to answer a practical question brands care about most:
What consistently improves engagement and reach, and what helps influencer marketing scale more predictably?
Influencer marketing works, but it becomes predictable only when brands treat it like a structured growth channel. Most inconsistency comes from relying on surface metrics without controlling the inputs that actually drive results. The brands that scale best focus on the levers they can repeat: creator tier strategy, niche fit, collaboration model, and format.
Section 2: Smaller creators win the race engagement
Influencer marketing in 2026 still follows a pattern brands have seen for years:
smaller creators generally drive higher engagement.
But what’s changed, and what most brands still miss, is why engagement shows up where it does, and why it doesn’t automatically translate into campaign success.
This section breaks down engagement in two layers:
- Where engagement is highest (creator tier performance)
- How consistent engagement is (what brands can expect most of the time)
2.1 Engagement by influencer tier: the 2026 baseline
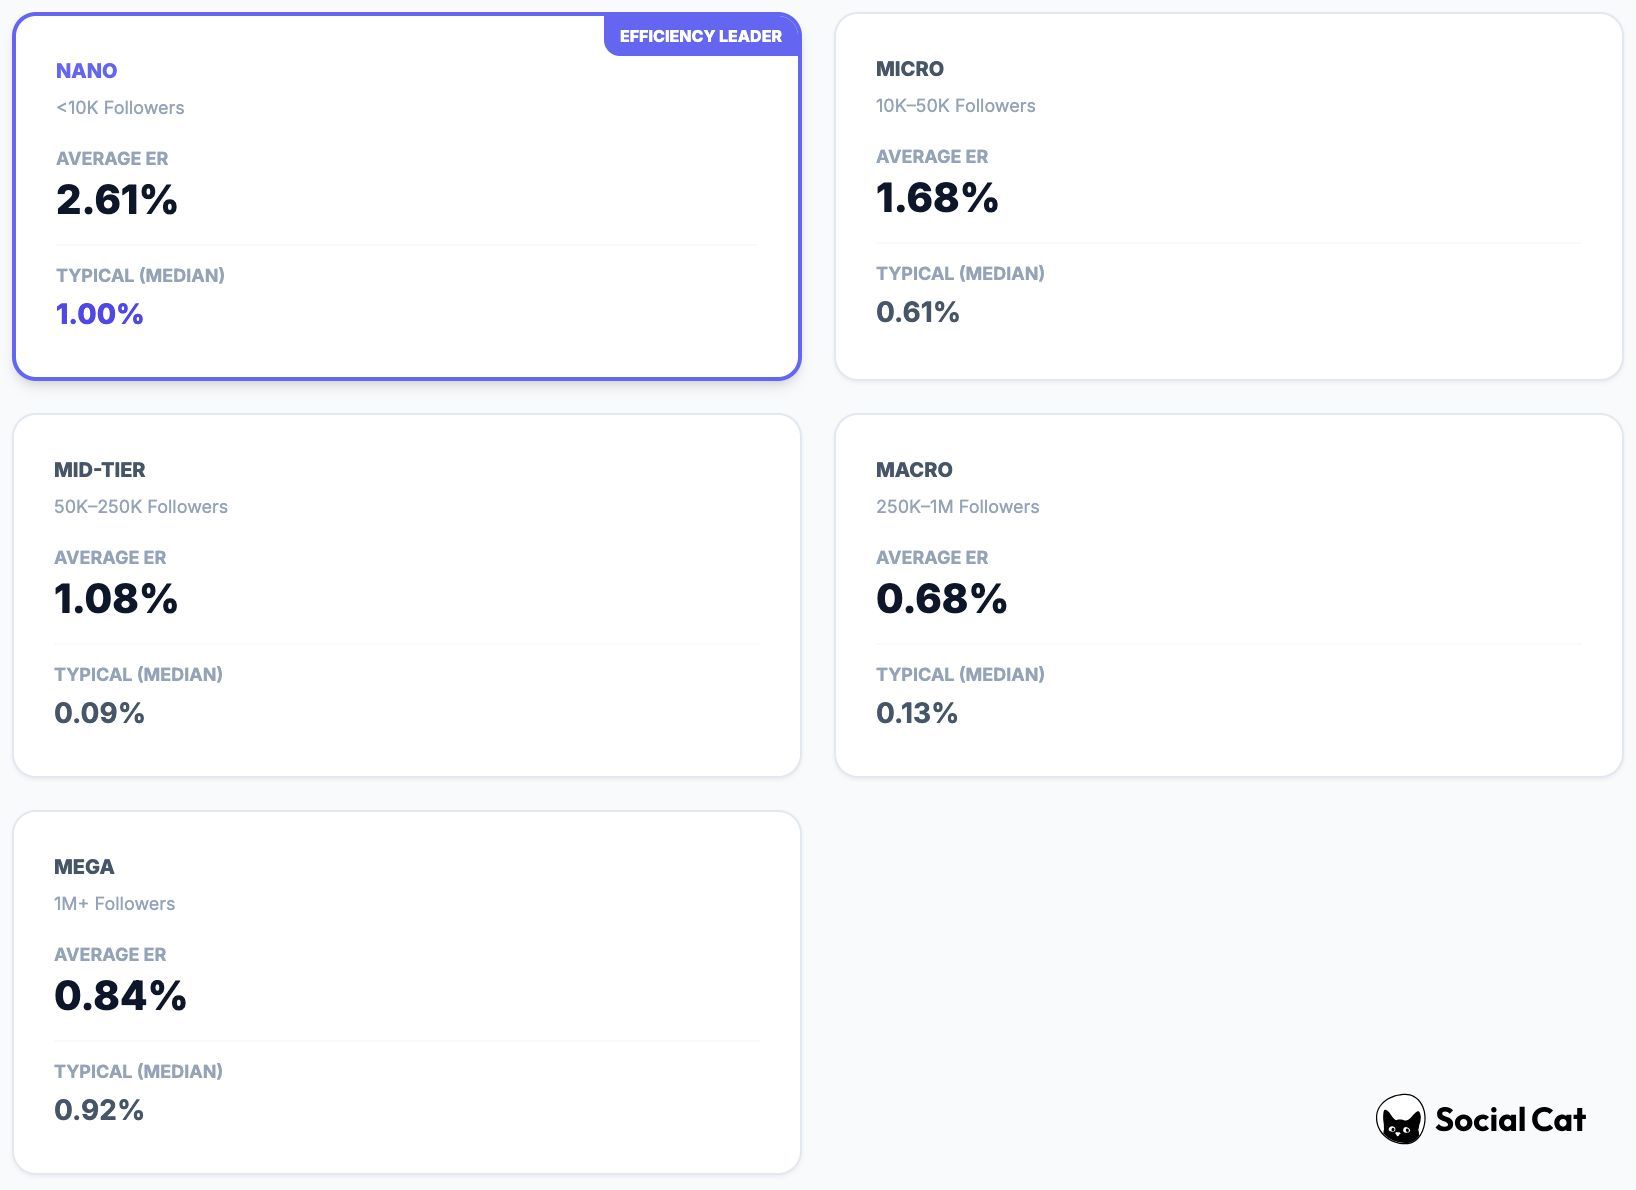
In the Instagram dataset (over 100,000 posts), engagement rate decreases as follower count increases, with the strongest engagement concentrated among smaller creators.
Engagement Rate by Influencer Category
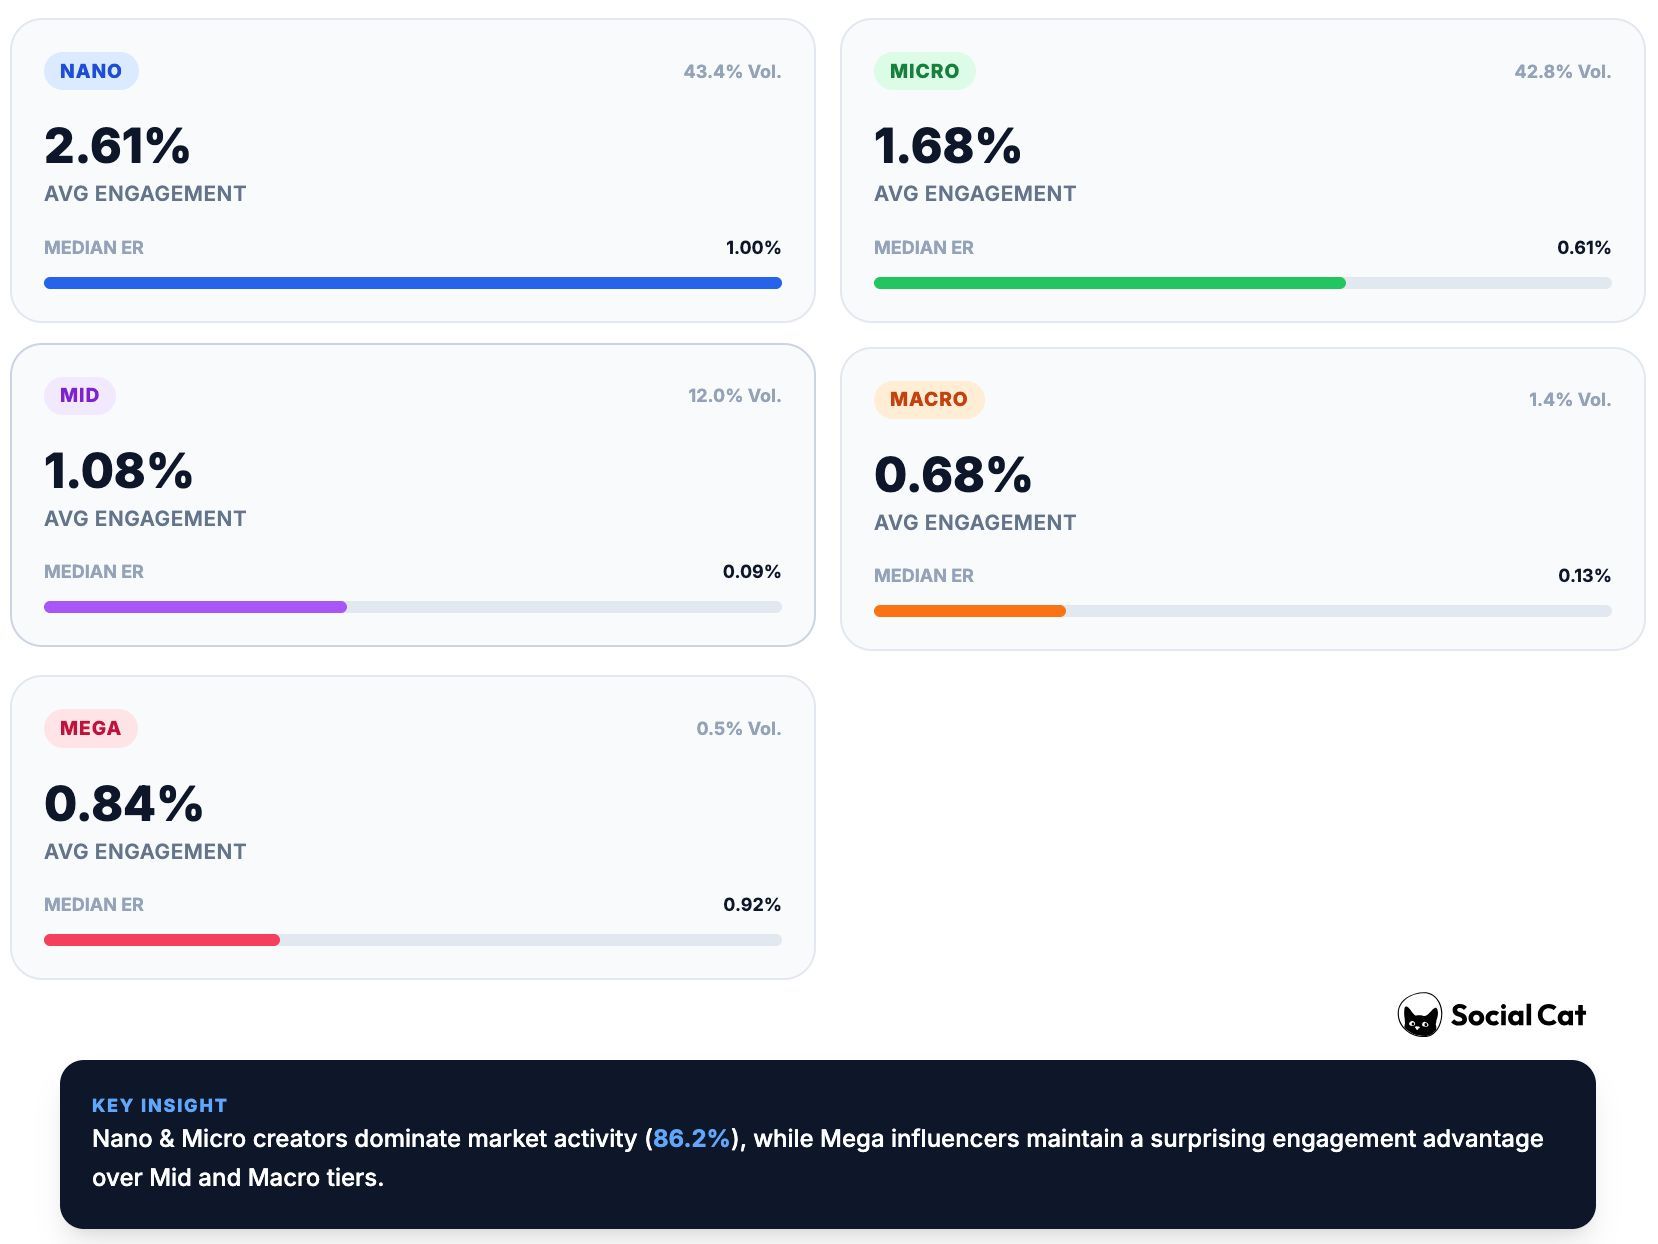
| Influencer Category | % of Posts | Avg ER (%) | Typical ER (%) |
| Nano (<10K) | 43.38% | 2.61% | 1.00% |
| Micro (10K–50K) | 42.80% | 1.68% | 0.61% |
| Mid-tier (50K–250K) | 11.98% | 1.08% | 0.09% |
| Macro (250K–1M) | 1.38% | 0.68% | 0.13% |
| Mega (1M+) | 0.45% | 0.84% | 0.92% |
Key takeaway:
Nano and micro influencers continue to lead engagement, and for many brands, they remain the most efficient tier for generating interaction.
Key takeaway:
Nano and micro influencers continue to lead engagement, making them the most efficient tier for generating interaction and community response.
2.2 The consistency gap: why engagement can feel unpredictable
A major reason influencer marketing can feel “random” is that engagement isn’t evenly distributed.
Across most tiers, average engagement is higher than typical engagement, which tells us something important:
- a small number of posts overperform massively
- those spikes pull the average up
- most posts perform closer to the typical result
So while a tier may look strong based on the average, the typical outcome brands experience day-to-day is often lower.
This is why brands sometimes feel like they’re chasing results:
- a few posts win big
- most posts perform normally
- and averages can create unrealistic expectations
What top brands do differently:
They don’t plan campaigns around averages.
They plan around typical performance, then treat outliers as upside.
2.3 What this means for brands in 2026
Engagement is still one of the most valuable metrics in influencer marketing, but only when it’s used correctly.
Engagement tells you:
✅ which creator tiers generate the most audience interaction
✅ where relevance and authenticity perform best
✅ which creators are likely to spark reactions quickly
Engagement does not tell you:
❌ how predictable performance will be across many collaborations
❌ how reach will scale as creators get larger
❌ which collaboration models improve distribution consistency (Gifted vs Paid)
That’s why the best influencer programs don’t optimize for engagement alone.
They optimize for engagement + consistency, using tactics like:
- strong niche alignment
- deliberate content format strategy
- and collaboration model choices that improve predictable reach
2.4 Practical recommendations (how to use this insight)
To turn engagement into a scalable strategy, brands should treat creator tiers like roles in a system:
- Nano creators: best for engagement efficiency and trust-driven interaction
- Micro creators: strong engagement with more reach flexibility
- Mid-tier and above: lower engagement efficiency, but stronger distribution potential
The goal isn’t choosing one tier forever.
The goal is building a creator mix that matches your outcome:
- engagement-first campaigns → prioritize nano and micro
- reach-first campaigns → scale distribution through larger creators and Paid models
- performance stability → optimize for typical outcomes, not averages
Section takeaway
In 2026, smaller creators are still the strongest engagement drivers — but the real advantage comes from understanding the difference between:
high engagement potential
vs
repeatable engagement performance
And that sets up the next section, where we break down how campaign structure (Gifted vs Paid vs Affiliate) changes reach consistency and scalability.
Nano and micro creators continue to deliver the strongest engagement, making them the best tier for interaction and community response. The brands that scale efficiently plan around typical results, then treat breakout posts as upside, not the baseline.
Section 3: Engagement isn’t the Problem, consistency Is
High engagement is often treated as the ultimate indicator of influencer performance. And on the surface, that makes sense: more likes, more comments, more attention, more impact.
But in 2026, engagement alone tells only part of the story.
Across over 100,000 posts, one insight stands out:
high engagement can be real, and still be inconsistent.
That’s why many brands experience influencer marketing as unpredictable:
they optimize for the biggest engagement wins, but build strategies around results that are difficult to repeat.
3.1 The gap between “headline performance” and “typical performance”
A major reason influencer marketing feels inconsistent is that performance is not evenly distributed.
In most influencer tiers:
- average engagement looks strong
- but typical engagement is much lower
This means a small number of standout posts pull the average up, while most collaborations perform closer to the typical result.
In practice:
Engagement is a great signal of efficiency, but the most scalable programs are built around what performs consistently, not just what spikes occasionally.
3.2 Why this matters when brands scale
When influencer marketing is run at low volume, outliers feel like big wins.
But at higher volume, brands need something different:
- predictability
- repeatable performance
- stable distribution outcomes
That’s where strategy starts to matter more than individual creator performance.
The brands that scale successfully don’t just chase engagement — they combine engagement with the levers that improve consistency, such as:
- niche alignment
- format choice
- collaboration model selection (Gifted vs Paid)
3.3 What brands should do in 2026
Engagement should still be part of creator selection, but it should be used correctly:
✅ Use engagement to identify creator efficiency
✅ Use typical results to plan expectations
✅ Use Paid collaborations when reach consistency matters
✅ Use niche alignment to improve both engagement and views
✅ Use format strategy to reduce volatility (Carousels for consistency, Reels for discovery)
3.4 High engagement can still create unpredictable outcomes
- Nano (<10K): Avg ER 2.61%, Typical ER 1.00%
- Micro (10K–50K): Avg ER 1.68%, Typical ER 0.61%
- Mid-tier (50K–250K): Avg ER 1.08%, Typical ER 0.09%
- Macro (250K–1M): Avg ER 0.68%, Typical ER 0.13%
- Mega (1M+): Avg ER 0.84%, Typical ER 0.92%
What this means:
A few posts overperform massively and pull averages up — but most collaborations perform closer to the typical outcome.
So if a brand plans around averages, results can feel inconsistent in execution and reporting.
This “average vs typical” effect shows up clearly when comparing collaboration types.
Engagement is basically the same:
- Gifted: Avg ER 2.01% (Typical 0.75%)
- Paid: Avg ER 2.00% (Typical 0.66%)
But views are not the same:
- Gifted: Avg Views 7,665 (Typical 800)
- Paid: Avg Views 22,904 (Typical 1,765)
Interpretation:
Gifted can win with spikes, but Paid delivers stronger baseline distribution, which makes outcomes easier to scale and forecast.
Section takeaway
In 2026, influencer marketing performance doesn’t come from chasing the highest engagement posts.
It comes from building a system that produces strong results consistently, across creators, formats, and collaboration types.
High engagement is valuable, but it’s not always repeatable. The biggest performance issue in influencer marketing isn’t whether posts can win, it’s whether results hold steady across many posts and creators. Scaling requires moving from “headline results” to systems that consistently produce solid outcomes.
Section 4. Paid collaborations drive significantly higher reach
Gifted and paid collaborations are often framed as a simple trade-off:
- Gifted = cost-efficient, better engagement
- Paid = higher quality, better performance
- Affiliate = performance-based, “win-win”
But in 2026, the data shows the reality is more nuanced.
The biggest difference between collaboration models isn’t only engagement, it’s distribution consistency, repeatability, and how predictable outcomes are at scale.
This section breaks down how Gifted, Paid, and Affiliate collaborations perform across engagement and views, using post-level outcomes from over 100,000 posts.
4.1 Collaboration type distribution: what brands actually run
In the Instagram performance dataset, collaboration types break down as follows:
| Collaboration Type | % of Posts |
| Gifted | 77.35% |
| Paid | 11.62% |
| Affiliate | 10.94% |
| Missing / unspecified | 0.09% |
This split is important because it reflects how most influencer marketing programs operate in practice:
Gifted campaigns dominate because they’re easier to launch, easier to test, and easier to scale in volume.
Paid campaigns appear in smaller volume, often used more selectively, or after performance signals are confirmed.
4.2 Engagement Rate: gifted and paid are essentially equal
One of the most surprising findings is how small the engagement gap actually is.
Engagement rate by collaboration type
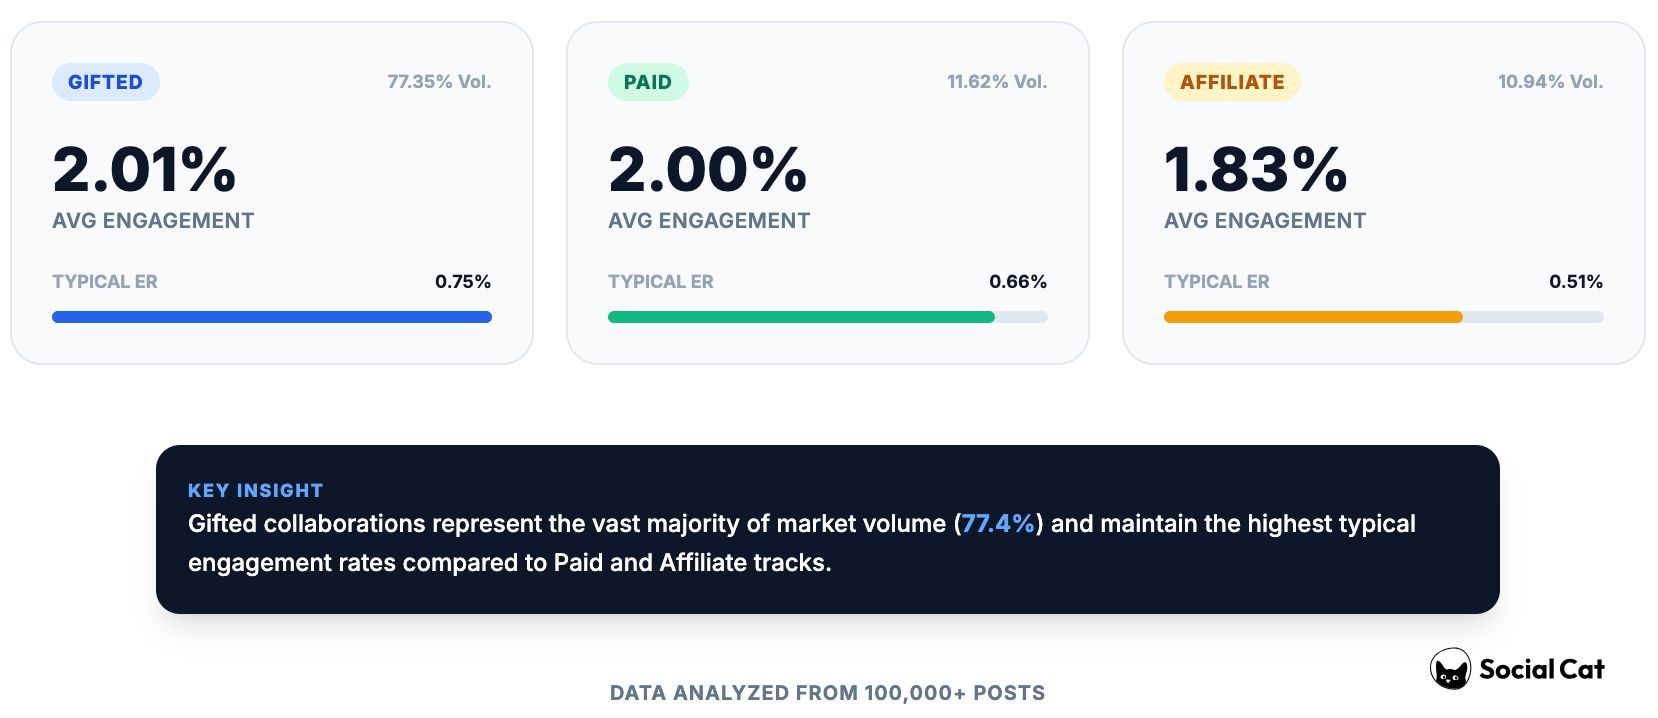
| Collaboration Type | % of Posts | Avg ER | Typical ER |
| Gifted | 77.35% | 2.01% | 0.75% |
| Paid | 11.62% | 2.00% | 0.66% |
| Affiliate | 10.94% | 1.83% | 0.51% |
Key takeaway:
Gifted and Paid collaborations generate nearly identical average engagement rates.
This matters because it challenges a common assumption in influencer marketing:
Paying more does not automatically buy higher engagement.
Instead, engagement appears to be driven more by:
- creator audience fit
- content relevance
- niche alignment
- format selection
…than by compensation type alone.
Affiliate campaigns perform slightly lower on engagement, which often reflects a practical reality: affiliate collaborations are frequently run at scale and may include a wider mix of creators, including more loosely aligned matches.
4.3 Views: paid collaborations drive significantly higher reach
Engagement tells only half the story.
When we look at views, the picture changes immediately.
Views by collaboration type
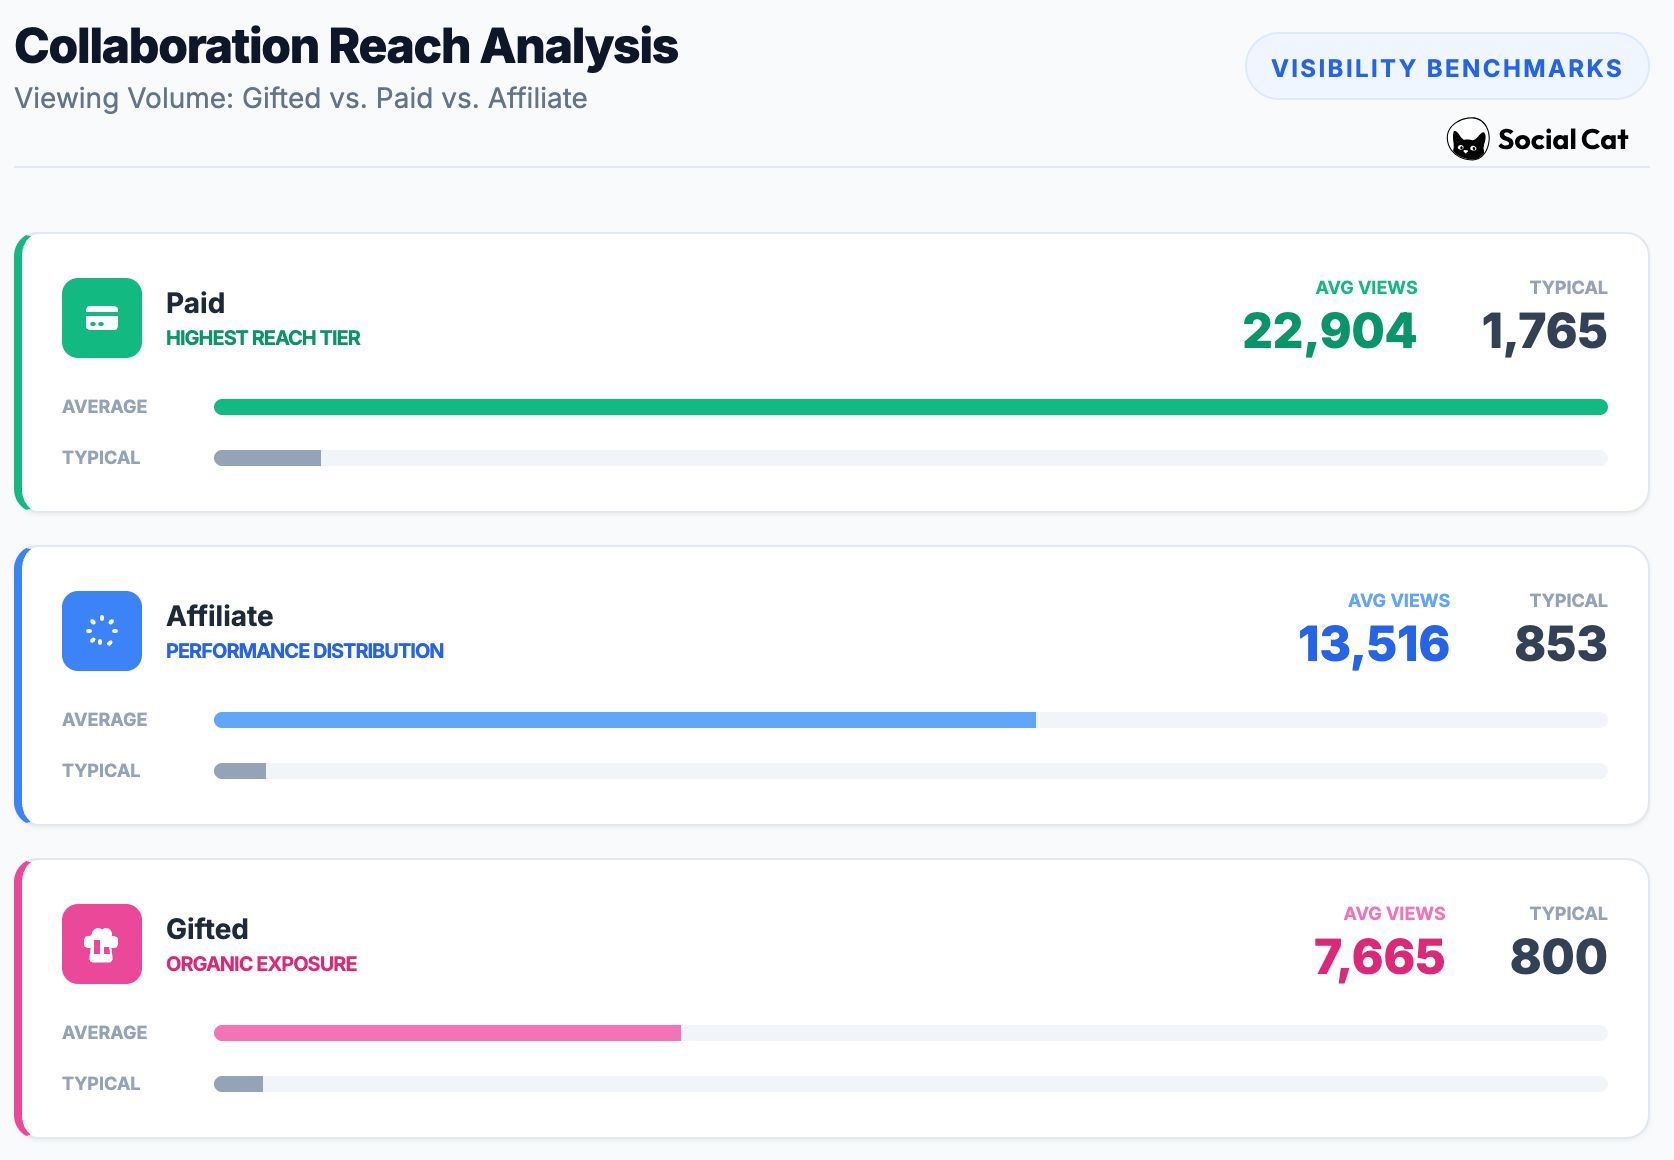
| Collaboration Type | Avg View | Typical Views |
| Gifted | 7,665 | 800 |
| Paid | 22,904 | 1,765 |
| Affiliate | 13,516 | 853 |
Key takeaway:
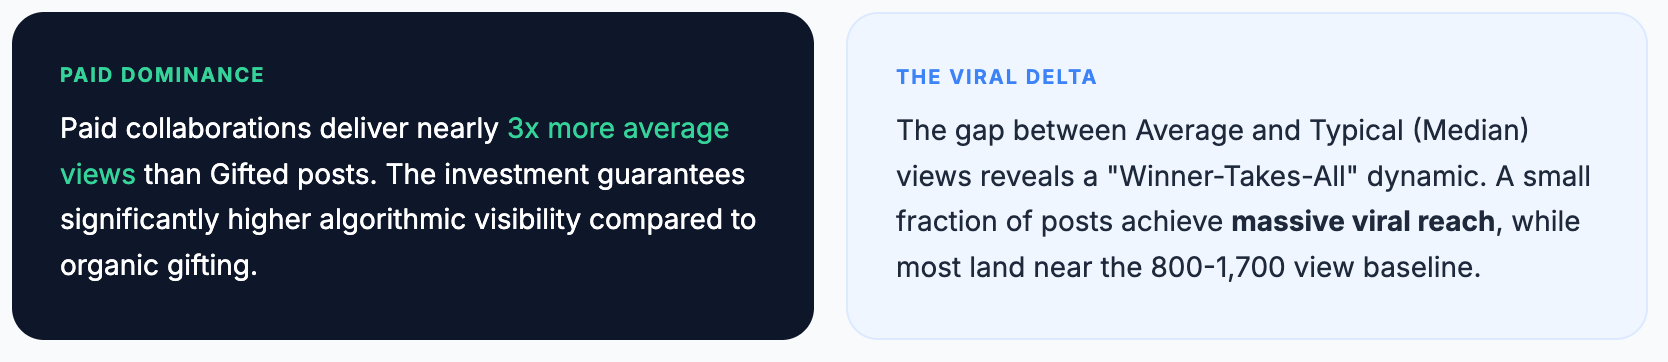
Paid collaborations deliver roughly 3× higher average views compared to Gifted.
More importantly, Paid also delivers ~2× higher typical views, meaning reach isn’t just driven by rare spikes, it’s more consistent across campaigns.
4.4 What this means in practice: engagement isn’t the differentiator
When brands choose between Gifted and Paid, the assumption is often that the decision controls engagement.
The dataset shows something different:
Gifted is best for:
- creator discovery
- rapid testing
- high-volume seeding
- cost-efficient engagement exploration
Paid is best for:
- stronger distribution consistency (views)
- more predictable reach at scale
- scaling output faster with confidence
In 2026, the biggest scaling advantage isn’t engagement, it’s reach predictability.
4.5 Where affiliate fits in 2026
Affiliate collaborations can work extremely well, but only under the right conditions:
- strong creator–product fit
- clear incentive alignment
- consistent tracking expectations
In this dataset:
- affiliate engagement is slightly lower than Gifted/Paid
- views are higher than Gifted, but below Paid
The takeaway isn’t that affiliate “doesn’t work.”
It’s that affiliate models require tighter matching and clearer creator qualification to perform consistently.
4.6 The 2026 conclusion: Paid buys consistency, not engagement
The takeaway is simple and actionable:
- Gifted and Paid deliver similar engagement
- Paid delivers more consistent reach
- Affiliate sits in between and depends heavily on alignment quality
Or in one sentence:
You don’t pay for engagement, you pay for distribution certainty.
Gifted and Paid campaigns deliver nearly identical engagement, which proves that payment doesn’t automatically buy higher ER. The real difference is reach consistency: paid campaigns generate stronger typical distribution, making them easier to forecast and scale. Affiliate can perform well too, but its success depends heavily on strong matching and tighter execution.
Section 5. Gifted vs Paid: Same Brand Performance (Brands That Did Both)
Comparing Gifted vs Paid is easy to do, and easy to get wrong.
Most comparisons mix different brands, budgets, niches, and influencer tiers.
So instead of comparing campaign types in the abstract, we asked a stronger question:
When the same brand runs both Gifted and Paid collaborations, what actually changes?
5.1 Brands that used both models (baseline comparison)
In the Instagram dataset:
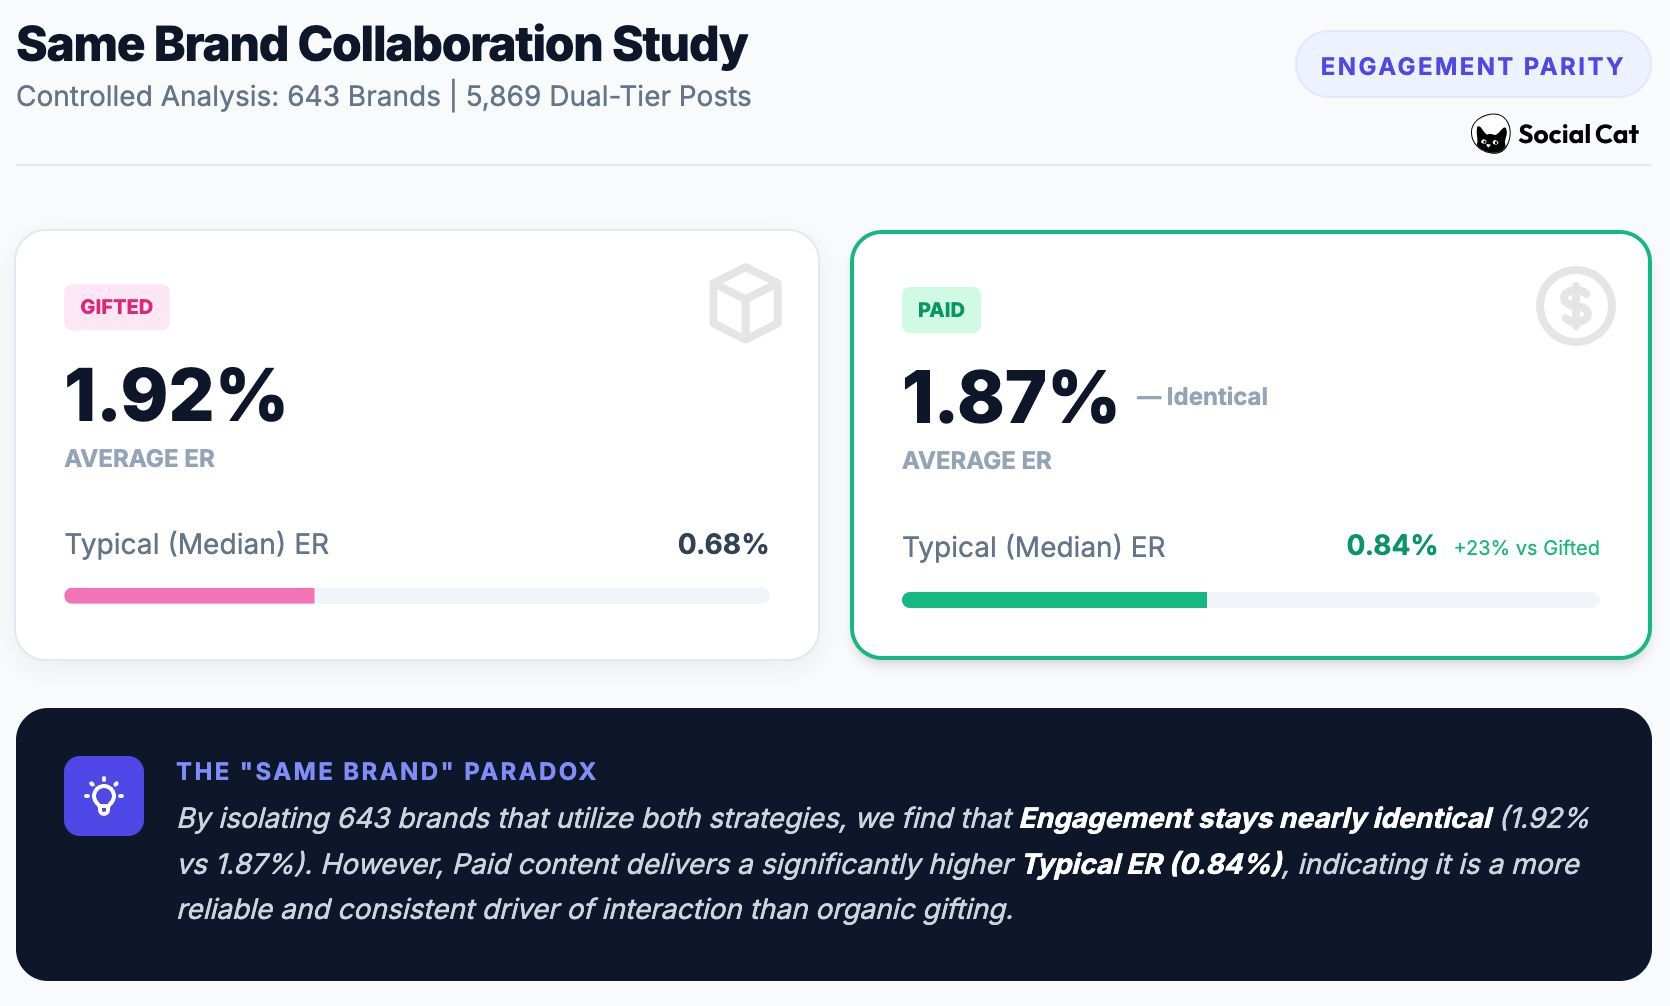
- 643 brands ran both Gifted + Paid collaborations
- 5,869 posts were analyzed inside these brands
Engagement stays nearly identical:
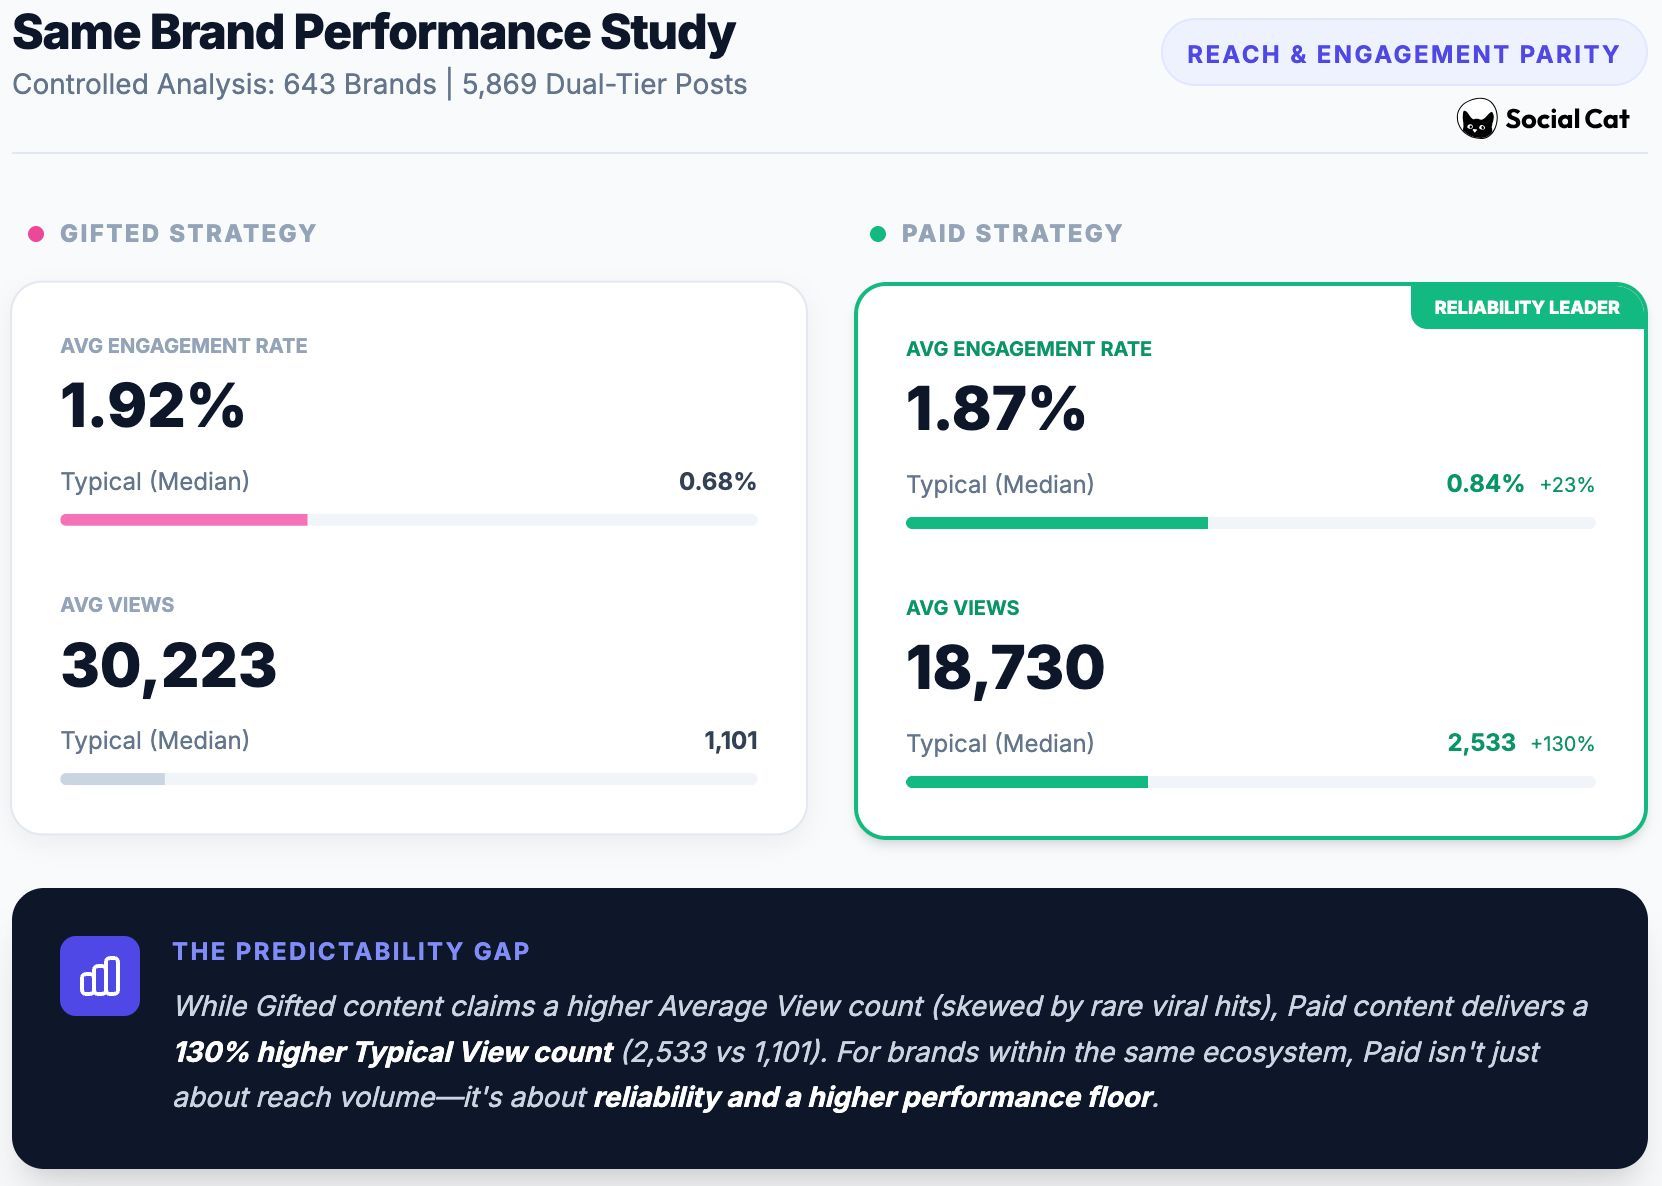
- Gifted: 1.92% average ER (typical: 0.68%)
- Paid: 1.87% average ER (typical: 0.84%)
Key takeaway: Paid doesn’t meaningfully increase engagement, it improves consistency.
5.2 Reach is where Paid wins
Views sho the biggest difference between models:
- Gifted: 30,223 average views (typical: 1,101)
- Paid: 18,730 average views (typical: 2,533)
Gifted sometimes spikes higher due to viral outliers, but Paid delivers stronger typical reach, meaning it performs more consistently across campaigns.
5.3 A cleaner comparison: stable brands (3+ posts on both sides)
To remove edge cases, we focused on brands with meaningful volume:
- 100 brands with 3+ Gifted and 3+ Paid posts
Results stayed consistent:
Engagement
- Gifted: 1.82% (typical: 0.63%)
- Paid: 1.77% (typical: 0.78%)
Views
- Gifted: 7,655 (typical: 1,054)
- Paid: 15,986 (typical: 2,372)
Key takeaway: Paid generates ~2× higher typical views, even when engagement stays similar.
5.4 What brands should do with this insight
The decision isn’t “Gifted vs Paid.”
The decision is how to use both strategically:
- Gifted for discovery and testing
- Paid for consistent reach and scaling what works
✅ Section takeaway:
Gifted and Paid perform similarly on engagement, but Paid is the lever brands use to scale reach more predictably.
When the same brands run both gifted and paid campaigns, engagement stays similar, but paid wins on consistent reach. Gifted can create occasional breakout results, but paid performs more reliably in typical outcomes. In practice, brands use gifted for discovery and paid to scale what’s already proven.
Section 6. Niche-Aligned Campaigns Deliver Higher Engagement and Views
Follower count and engagement rate dominate most influencer selection decisions. But when we analyze influencer marketing performance at scale, one factor consistently outperforms almost everything else: niche alignment.
In 2026, the brands that win aren’t only the ones working with the biggest creators, they’re the ones working with creators whose audiences are already primed to care.
This section shows why niche alignment is one of the strongest performance multipliers in influencer marketing, and why it often matters more than influencer size alone.
6.1 Why niche alignment works (and why it’s misunderstood)
The most successful influencer campaigns don’t feel like ads. They feel like content that naturally belongs in the creator’s feed.
That happens when niche alignment is strong.
Creators who operate inside a clear niche tend to build:
- audience relevance (followers who came for a specific topic)
- trust and authority (repeated proof they know what they’re talking about)
- predictable content expectations (audiences know what type of content they’ll get)
So when those creators promote a product aligned with that niche, the audience experiences it as:
- a recommendation
- a discovery
- a natural extension of the creator’s lifestyle, not a disruption.
That shift is what turns “brand content” into trusted content, and trust is what drives engagement.
6.2 The data: aligned campaigns outperform misaligned campaigns
Using the Instagram performance dataset (over 100,000 posts), we compared:
✅ Aligned collaborations: creator niche matches the brand industry
❌ Misaligned collaborations: creator niche does not match the brand industry
The results were clear:
| Niche Alignment | % of Posts | Avg ER | Typical ER | Avg Views | Typical Views |
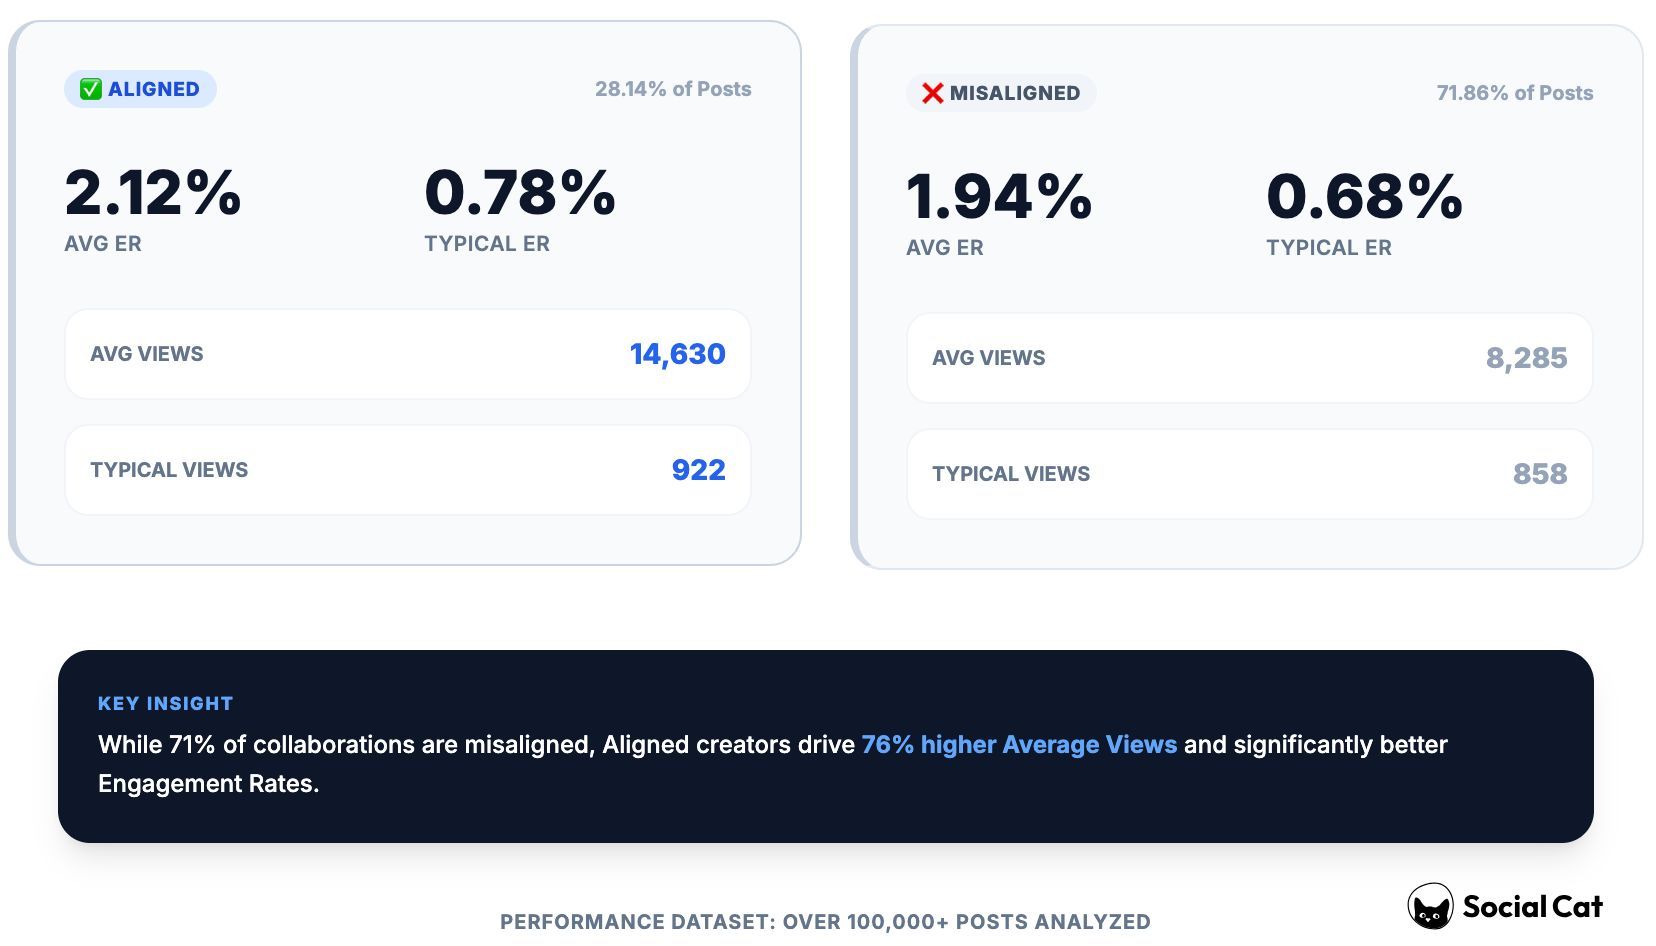
| Misaligned | 71.86% | 1.94% | 0.68% | 8,285 | 858 |
| Aligned | 28.14% | 2.12% | 0.78% | 14,630 | 922 |
What this means
Aligned campaigns deliver:
- higher engagement (both average and typical)
- and ~77% higher average views (significantly stronger distribution)
This is one of the strongest lifts in the entire report — and it doesn’t require higher budgets.
It requires better matching.
6.3 Where niche alignment helps the most (high-sensitivity categories)
Not all industries benefit equally from niche alignment. Some categories are extremely sensitive to fit, meaning poor matching produces immediate performance losses.
The largest engagement uplifts in the dataset appear in categories like:
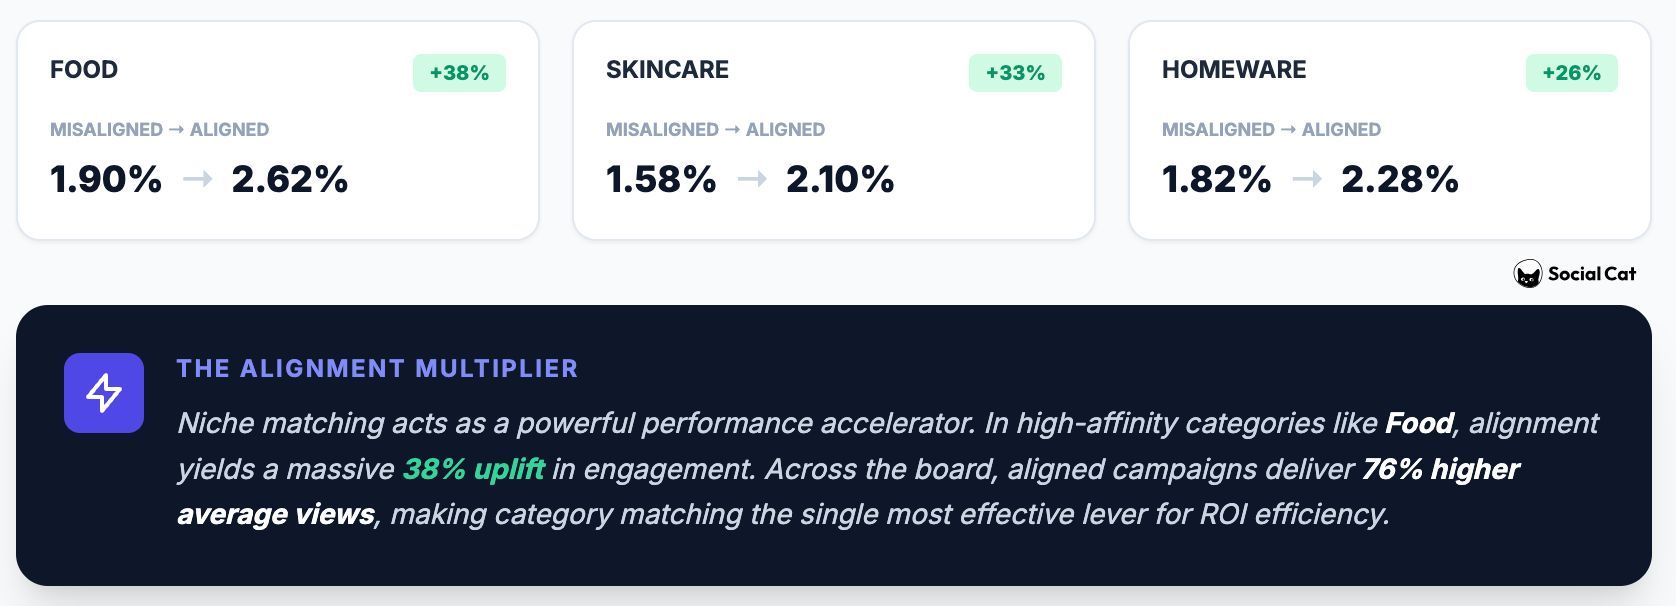
- Food: 1.90% → 2.62% (+38% uplift)
- Skincare: 1.58% → 2.10% (+33% uplift)
- Homeware: 1.82% → 2.28% (+26% uplift)
These are high-context products. People need to see them used in a believable environment, and creators who already live in that niche create that context naturally.
6.4 The cost of poor alignment: visibility without impact
Misaligned campaigns can still generate reach, especially with larger creators, but they tend to underperform where it matters most:
- engagement drops
- messaging feels forced
- outcomes become inconsistent
And worst of all, poor alignment can create the illusion of success:
the post goes live, gets views, looks active — but fails to generate meaningful interaction.
This reinforces a core principle of influencer marketing in 2026:
Visibility does not equal impact.
6.5 What brands should do in 2026
Brands that scale influencer marketing effectively treat niche alignment as a filter, not a bonus.
Practical alignment rules:
- Choose relevance over reach. A smaller aligned creator often outperforms a larger mismatched creator.
- Match niche to creator tier. Some niches thrive at nano/micro levels (trust-driven), others scale better with larger creators (trend-driven).
- Avoid forced integrations. If the product requires explaining “why this fits,” the audience already feels the mismatch.
- Use alignment as the first step. Before evaluating follower count or engagement rate, ensure the creator is a natural fit.
Section takeaway
Across tens of thousands of posts, one conclusion is consistent:
Engagement is driven by relevance, not reach.
Niche alignment doesn’t just improve performance, it improves predictability.
And in 2026, predictability is what separates brands that “try influencer marketing” from brands that scale it successfully.
Niche alignment is one of the biggest multipliers in influencer marketing because it makes content feel natural instead of forced. Aligned campaigns outperform misaligned ones in both engagement and reach, and they do it without requiring bigger budgets. If brands want more predictable results, better matching is the fastest lever they can pull.
Section 7. Reels bring upside. Carousels bring consistency, and consistency is what scales.
- Most influencer marketing strategies focus heavily on creator selection: audience size, niche, engagement rate, past performance.
- But in 2026, one of the biggest levers brands can control is simpler:
- content format.
- Even with the same creator and the same product, format changes how audiences respond. Some formats drive discovery. Others drive conversation. And some deliver the most consistent engagement across campaigns.
- This section breaks down performance across over 100,000 posts, comparing Reels, Carousels, and Images by likes, comments, engagement rate, and consistency.
7.1 Likes + comments by format (what audiences do)
First, we look at raw engagement outputs: the average and typical number of likes and comments per post.
Avg likes and comments by format
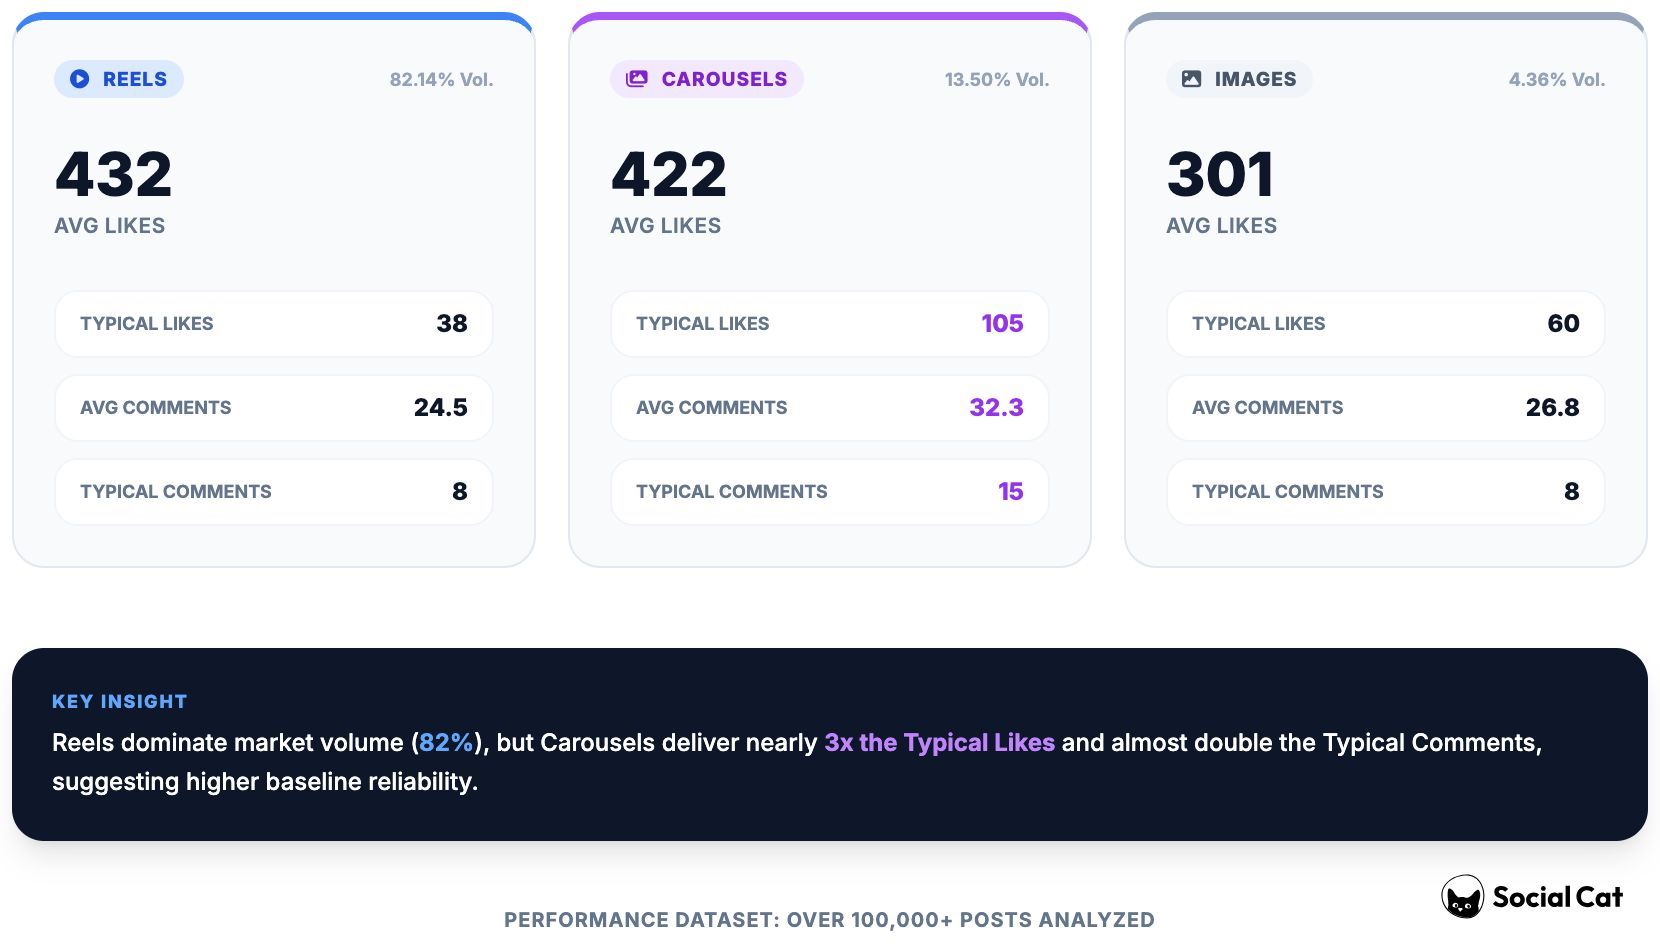
| Content Type | % of Posts | Avg Likes | Typical Likes | Avg Comments | Typical Comments |
| Reels | 82.14% | 432 | 38 | 24.5 | 8 |
| Carousels | 13.50% | 422 | 105 | 32.3 | 15 |
| Images | 4.36% | 301 | 60 | 26.8 | 8 |
What this shows
- Reels lead on average likes → driven by occasional breakout performance
- Carousels lead on typical engagement and comments → stronger day-to-day consistency
- Images are lowest on likes overall, but still perform well in high-fit niches where product storytelling is the priority
Key takeaway:
Reels create upside. Carousels create consistency.
7.2 Engagement Rate by content type (the most comparable metric)
Likes and comments are useful, but they don’t account for audience size.
Engagement rate does.
Avg engagement rate by format
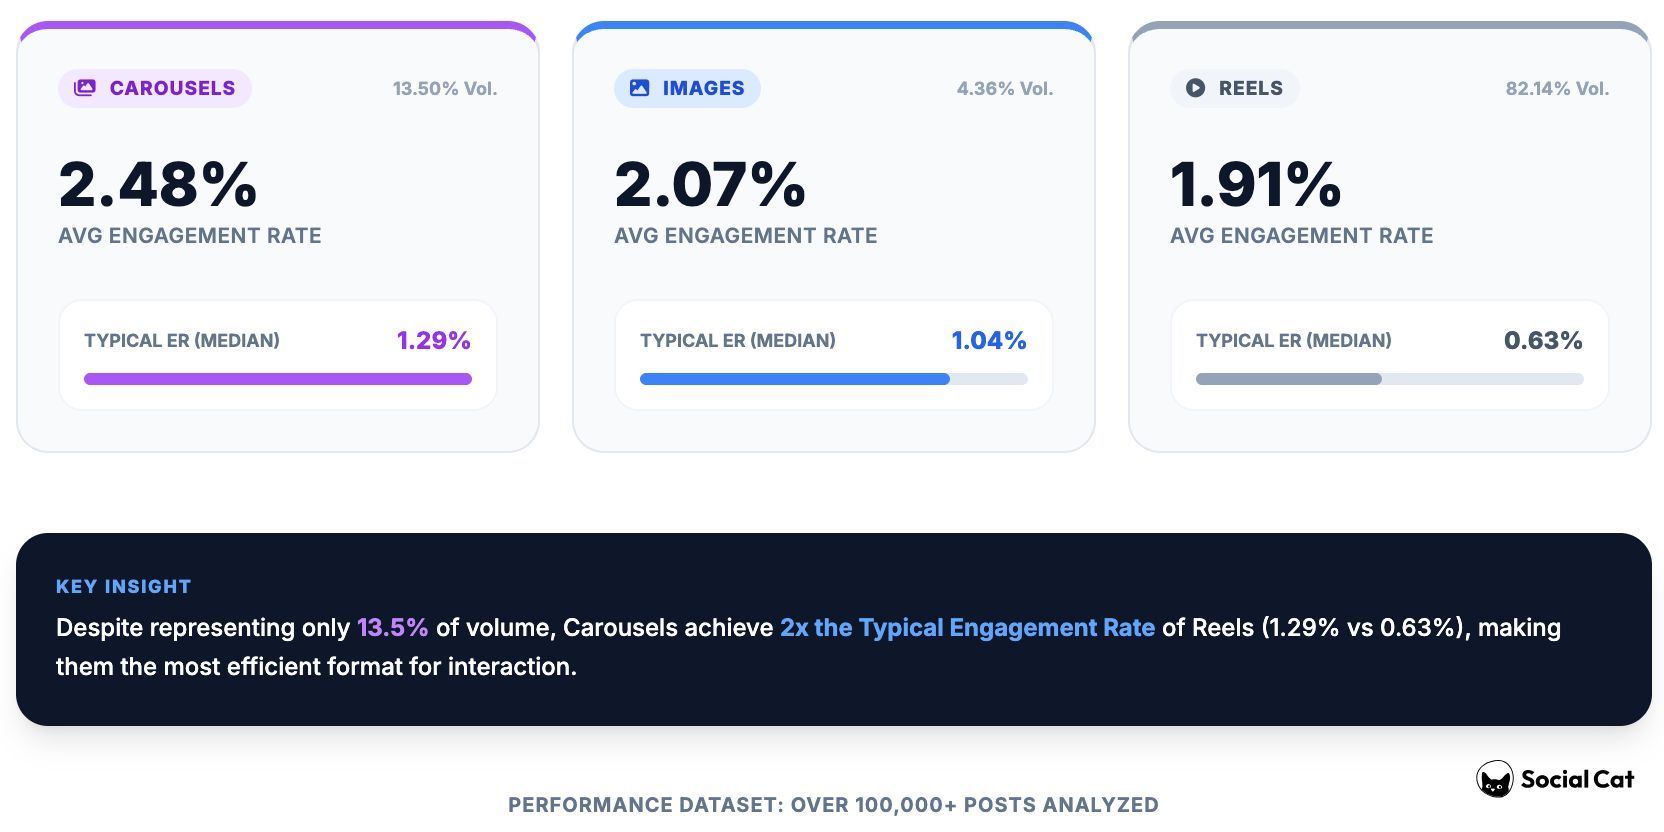
| Content Type | % of Posts | Avg Engagement Rate | Typical Engagement Rate |
| Carousels | 13.50% | 2.48% | 1.29% |
| Images | 4.36% | 2.07% | 1.04% |
| Reels | 82.14% | 1.91% | 0.63% |
Key takeaway:
Carousels deliver the strongest engagement rate, and the strongest typical performance, making them the most reliable format for consistent interaction.
7.3 Reels vs Carousels: viral upside vs repeatable engagement
This dataset makes one thing clear:
Reels = discovery and upside
Reels are the best format for reach and algorithm-driven distribution, but they’re more volatile.
A small percentage of Reels pull the average up significantly, while most perform closer to the typical result.
Carousels = consistent engagement
Carousels drive:
- higher typical likes
- more comments
- stronger typical engagement rate
They may not spike as often as Reels, but they deliver more predictable results across campaigns.
7.4 What brands should do in 2026
The biggest mistake brands make is choosing formats based on trends instead of outcomes.
Format should match the goal:
If your goal is reach and discovery
Use: Reels
Expect: higher upside, higher variance
If your goal is engagement and community response
Use: Carousels
Expect: stronger consistency, more comments, more repeatable interaction
If your goal is clean product storytelling
Use: Images
Expect: moderate engagement, best results when niche-aligned
Section takeaway
In 2026, format is a performance lever.
Reels win on upside. Carousels win on consistency.
The strongest influencer programs don’t choose one format, they build a portfolio:
- Reels for discovery
- Carousels for reliable engagement
- Images for clean product integration
Because scalable influencer marketing isn’t built on viral wins.
It’s built on repeatable outcomes.
Content format is a performance lever, not just a creative choice. Reels bring higher upside and discovery potential, but results are volatile, while Carousels deliver the most consistent engagement and comments. The strongest programs don’t pick one format, they build a mix designed for both reach and repeatable engagement.
Section 8. Quality, Satisfaction, and the Hidden Cost of Scaling
Views and engagement are what brands notice first. But in 2026, scaling influencer marketing depends on something more operational:
quality consistency.
8.1 Satisfaction stays high across tiers
Overall, brands rate collaborations positively, influencer marketing works.
Average star ratings by tier:
- Micro (1K–10K): 4.70
- Mid-tier (10K–50K): 4.69
- Macro (50K–100K): 4.58
- Large (100K+): 4.58
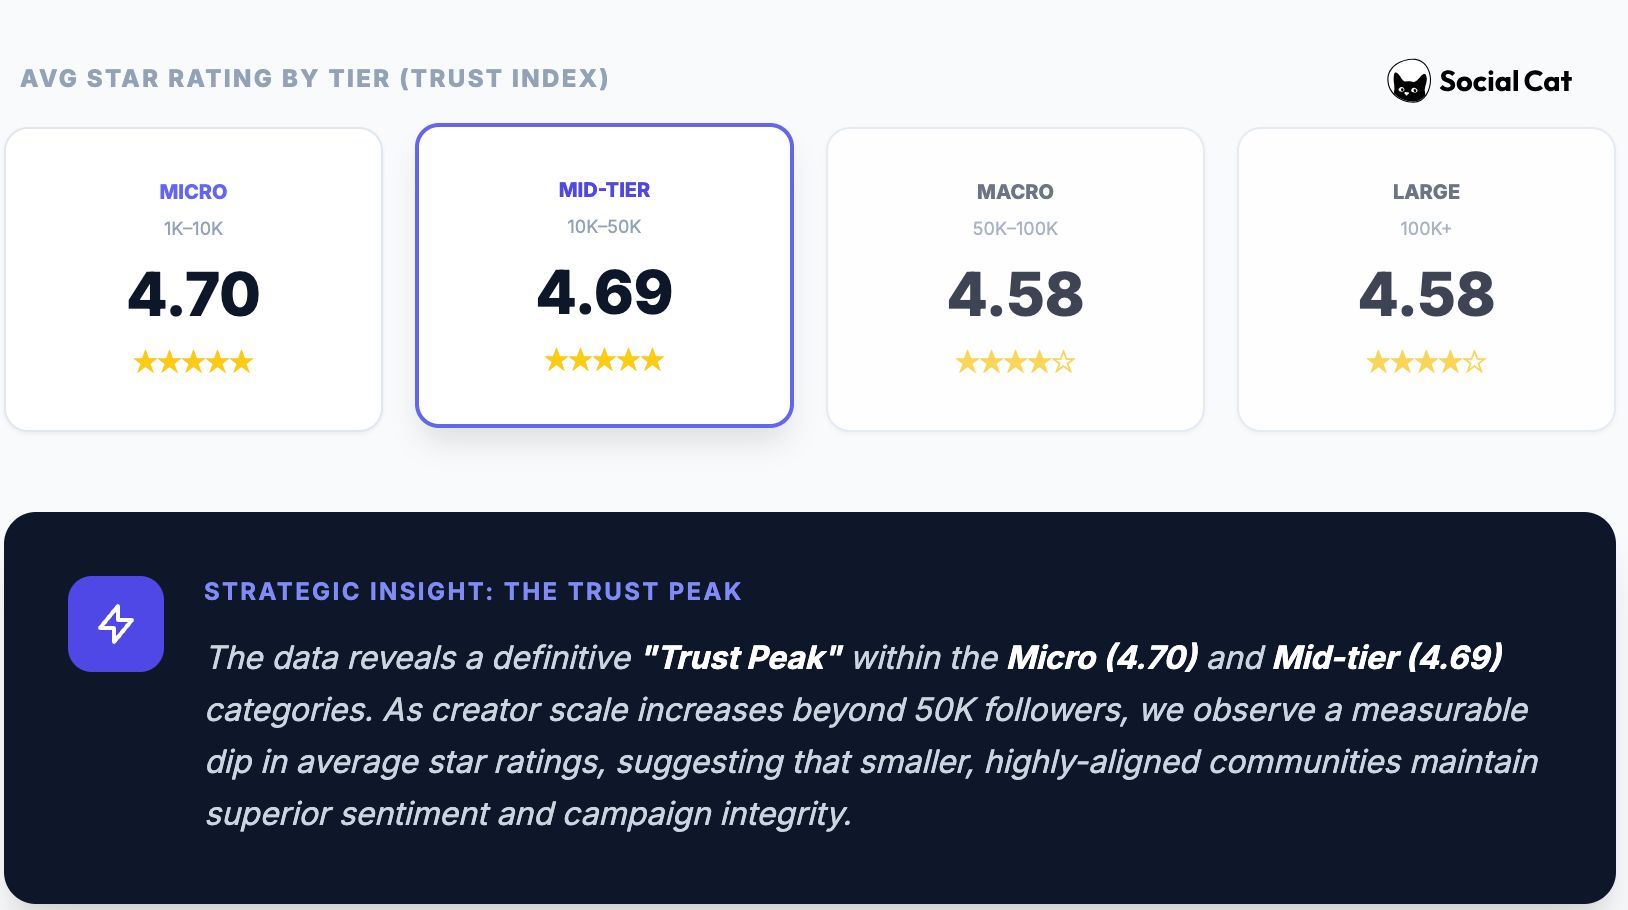
The takeaway is simple: satisfaction is strong across all tiers, but outcomes become slightly less standardized as creators scale.
8.2 Integration quality drives satisfaction
Brands don’t judge collaborations only by metrics. They care about:
- how naturally the product fits the content
- how clearly the message lands
- whether the creator matches the campaign goal
Smaller creators often deliver stronger “native” integrations, while larger creators amplify reach — which is why tier choice should match campaign intent.
8.3 Targeting clarity prevents quiet underperformance
Scaling campaigns fail quietly when targeting is too broad. Vague audience definitions lead to generic content that performs “okay,” but rarely drives meaningful impact.
The rule for 2026:
the bigger the creator, the sharper the targeting needs to be.
Section takeaway
Influencer marketing doesn’t break because it stops performing.
It breaks when quality becomes inconsistent.
The brands that scale successfully optimize for:
✅ integration quality
✅ targeting clarity
✅ consistent execution
Engagement is a strong signal of resonance, but scaling depends on consistency. Many influencer strategies fail because they plan around averages while real performance happens closer to typical results. Brands that grow sustainably use engagement to discover what works, then scale using the levers that reduce variance — paid distribution, strong alignment, and format strategy.
Section 9. Speed vs Reliability: Faster Publishing Does Not Improve Outcomes
Influencer marketing teams often treat speed as a proxy for execution quality.
Creators who publish quickly are assumed to be:
- more professional
- easier to manage
- less risky
- more reliable
And brands frequently pressure campaigns to move faster under the belief that shorter timelines improve performance.
But in 2026, the smarter view is this:
Speed may feel efficient, but it isn’t a performance guarantee.
The strongest influencer programs aren’t built on urgency.
They’re built on predictable workflows and high-quality execution.
9.1 Why “posting faster” doesn’t automatically improve outcomes
Publishing quickly can be useful, but it doesn’t guarantee:
- better engagement
- better product integration
- better audience response
- better brand experience
Fast campaigns can still underperform if:
- the product fit is weak
- the brief is unclear
- the format choice is wrong
- the integration feels rushed
In other words, speed helps with timing, but it doesn’t replace strategy.
10.2 Quality is built before publishing begins
The campaigns that feel effortless on the outside are usually structured on the inside.
Execution quality tends to come from:
- clear expectations
- strong creator–product fit
- a simple, repeatable brief
- format guidance (Reels vs Carousels vs Images)
- enough time for the creator to produce content that feels natural
By the time a post goes live, most of the success factors have already been decided.
9.3 When optimizing for speed hurts performance
Speed becomes dangerous when it turns into urgency.
Rushed campaigns often lead to:
- weaker alignment and messaging
- surface-level integrations
- generic content that blends into the feed
- less consistent results across creators
At small scale, this can be manageable.
At scale, it creates volatility, because the system produces more “okay” content, and fewer standout integrations.
9.4 What brands should do instead in 2026
The best influencer teams treat speed as a constraint, not a KPI.
Practical recommendations
- Optimize for predictability, not speed
- Use clear publishing windows instead of pressure
- Standardize briefs so creators execute faster without rushing
- Choose formats intentionally
- Reels for discovery
- Carousels for consistent engagement
- Build workflows that produce quality repeatedly
Section takeaway
Fast publishing can feel productive, but it doesn’t guarantee better performance.
In 2026, the teams that win aren’t the ones that move fastest.
They’re the ones that reduce uncertainty and deliver consistently high-quality content at scale.
Fast publishing can feel like progress, but it doesn’t automatically improve results. In 2026, the strongest campaigns aren’t driven by urgency, they’re driven by clarity: better fit, better briefs, and repeatable execution. Brands that scale influencer marketing successfully don’t win by pushing creators to post faster, they win by building workflows that consistently produce strong content at a predictable pace.
How to Use This Report
This report is designed to help you make influencer marketing decisions faster, with less guesswork, and with stronger outcomes at scale. You can read it end-to-end, but the best way to use it is based on where your program is right now.
If you’re running early-stage influencer campaigns (1–50 collaborations/month)
Your priority is to prove what works without wasting time or inventory.
Focus on:
- Niche alignment first (relevance beats reach)
- Micro + nano creators for engagement efficiency
- Carousels + Reels as the core content mix
- Completion reliability tracking from day one
- Building a shortlist of creators you can reuse
The goal isn’t more campaigns. It’s a repeatable system you can scale.
If you’re scaling (50–500 collaborations/month)
Your priority is to reduce volatility and improve throughput.
Focus on:
- Increasing completion rate (execution becomes your bottleneck)
- Running Gifted → Paid as a progression system
- Building a structured creator pool (reliable / growth / experimental)
- Measuring median performance (typical), not just averages
- Tracking repeat-worthy creators and rebooking quickly
At this stage, your ROI depends less on performance spikes and more on predictable output.
If you’re running high-volume programs (500+ collaborations/month)
Your priority is operational maturity: consistency, repeatability, and control.
Focus on:
- Execution KPIs as core performance drivers (not just engagement)
- Repeat systems to reduce churn and onboarding overhead
- Tier-based creator strategies by niche + platform behavior
- Standardized briefs, timelines, and QC scoring
- Measuring results per “campaign batch,” not per post
At scale, influencer marketing becomes an operations problem, and brands that solve it build an advantage competitors can’t copy quickly.

Written by
Stefan A.
Stefan is a Growth Marketer turned founder with a background in customer acquisition, Influencer Marketing, and early-stage startups. At Social Cat, Stefan drives day-to-day operations and growth, helping small brands connect with the right influencers to scale their reach and impact.