

This guide will walk you through essential metrics for your Influencer Marketing Campaigns on Instagram and how to track them.
Instagram Feed
Reach: the number of unique views on a post
Example: if 1000 different (individual) users see a piece of content on Feed → Reach = 1000
Impressions: the total number of times a post is seen
Example: if a post is seen 1200 times on Instagram → Impressions = 1200
💡 The total number of impressions is always higher than the total number of reached accounts
Example: A story/post was displayed 1200 times to users on Instagram, out of which 1000 users are unique → Impressions = 1200 and Reach = 1000
Likes: how many times your post or reel has been liked by people
Comments: how many comments you got on your post or reel
When working with Instagram influencers, it is vital to ensure the engagement is authentic and not enhanced by using bots, engagement loops, or follow per follow loops.
Check the last 6 Feed posts of an Influencer. If the captions are very short and most of the comments are either emoji or very short spammy sentences - this is usually a sign of fake engagement.
Post Saves: You can see how many users saved a post on Instagram. This is not a crucial metric, but it can show how interested users are in your product. They might convert at a later date.
💡 Opt for a Feed Campaign if you are looking for long-term Brand Awareness and photo content for your marketing channels. Depending on the type of brand you are running, getting content from influencers is a great way to cover your marketing channels and materials.
This content is a great asset for Facebook or Instagram ads. More on this subject, in this guide.
Would you like to get started with influencer marketing? Start a free trial with Social Cat and collaborate with micro-influencers to get sales, brand awareness and user-generated content.
Instagram Stories
Reach: the number of unique views on a story
Example: if 1000 different (unique) users see a story → Reach = 1000
Impressions: the total number of times a story is seen
Example: if a story is seen on a screen 1200 times → Impressions = 1200
Link Clicks: how many times users clicked on a link sticker from Stories
💡 Link Stickers are available for brands and creators with less than 10.000 followers too. It is not necessary to have a minimum amount of followers for this feature.
Cost-per-Click (CPC):
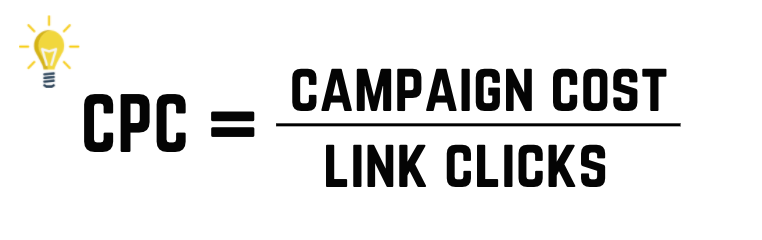
Compare this data from multiple influencers and correlate it with the CPM and the conversion rate to understand which influencer and which audience is performing better for your brand.
Cost per 1000 Impressions (CPM):
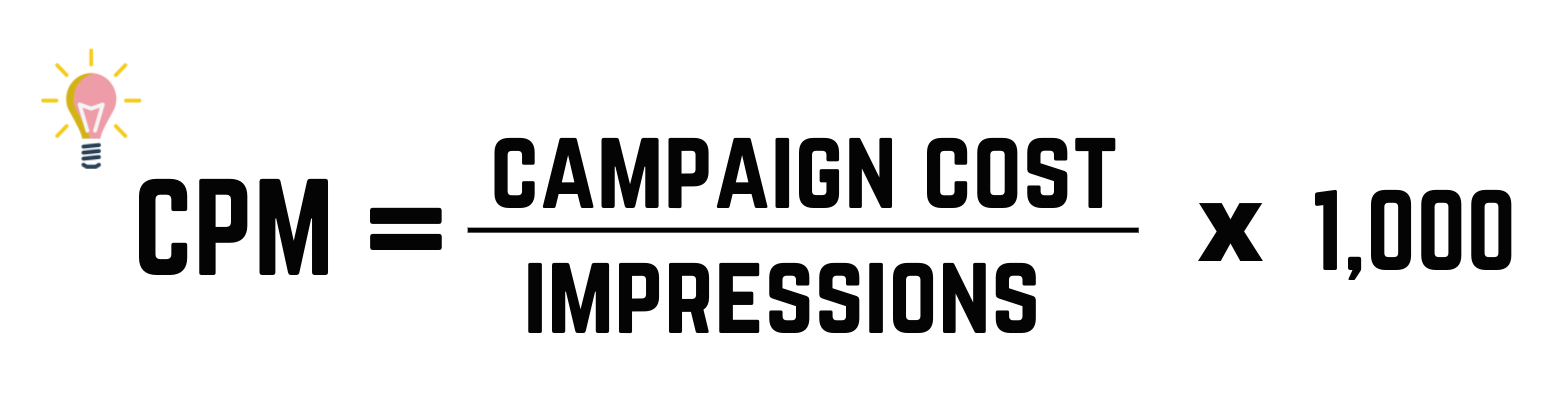
Impressions - the average number of Impressions from the last 3 Stories is the most relevant here. Try to avoid dividing by impressions just from one or old stories, as it might not be relevant. What you need is new data.
Get this data from multiple influencers alongside the CPC. Compare them to each other and better understand which influencer (and which audience) is performing better.
Conversions: how many actions (usually sales) do you generate with this campaign
Conversion is defined as any desired action taken by a user: download, sale, booking or more, but for this example, we focus on sales as a conversion.
We strongly recommend tracking this via a discount code. For each influencer or campaign, create a unique discount code and provide it to them.
Track conversions alongside CPC and CPM and understand which influencer is performing better.
Engagement Rate: the engagement rate shows how engaged an influencer is with his audience
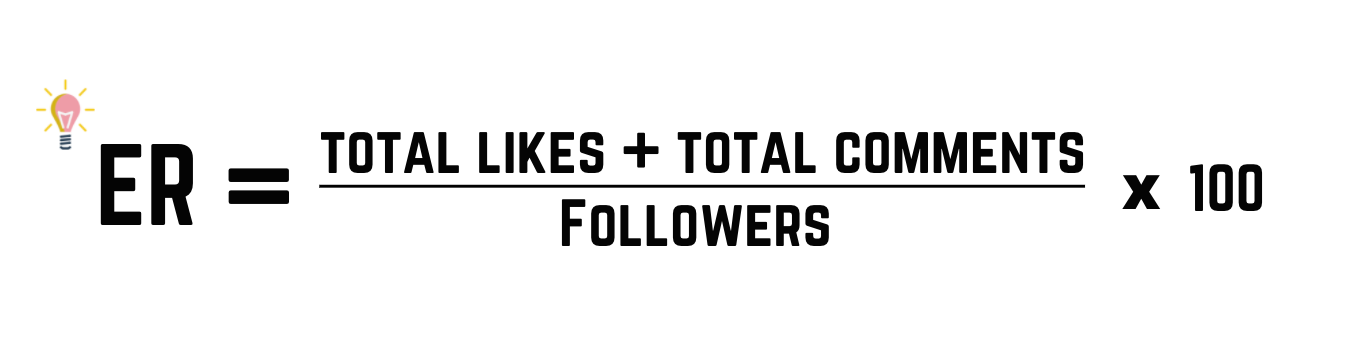
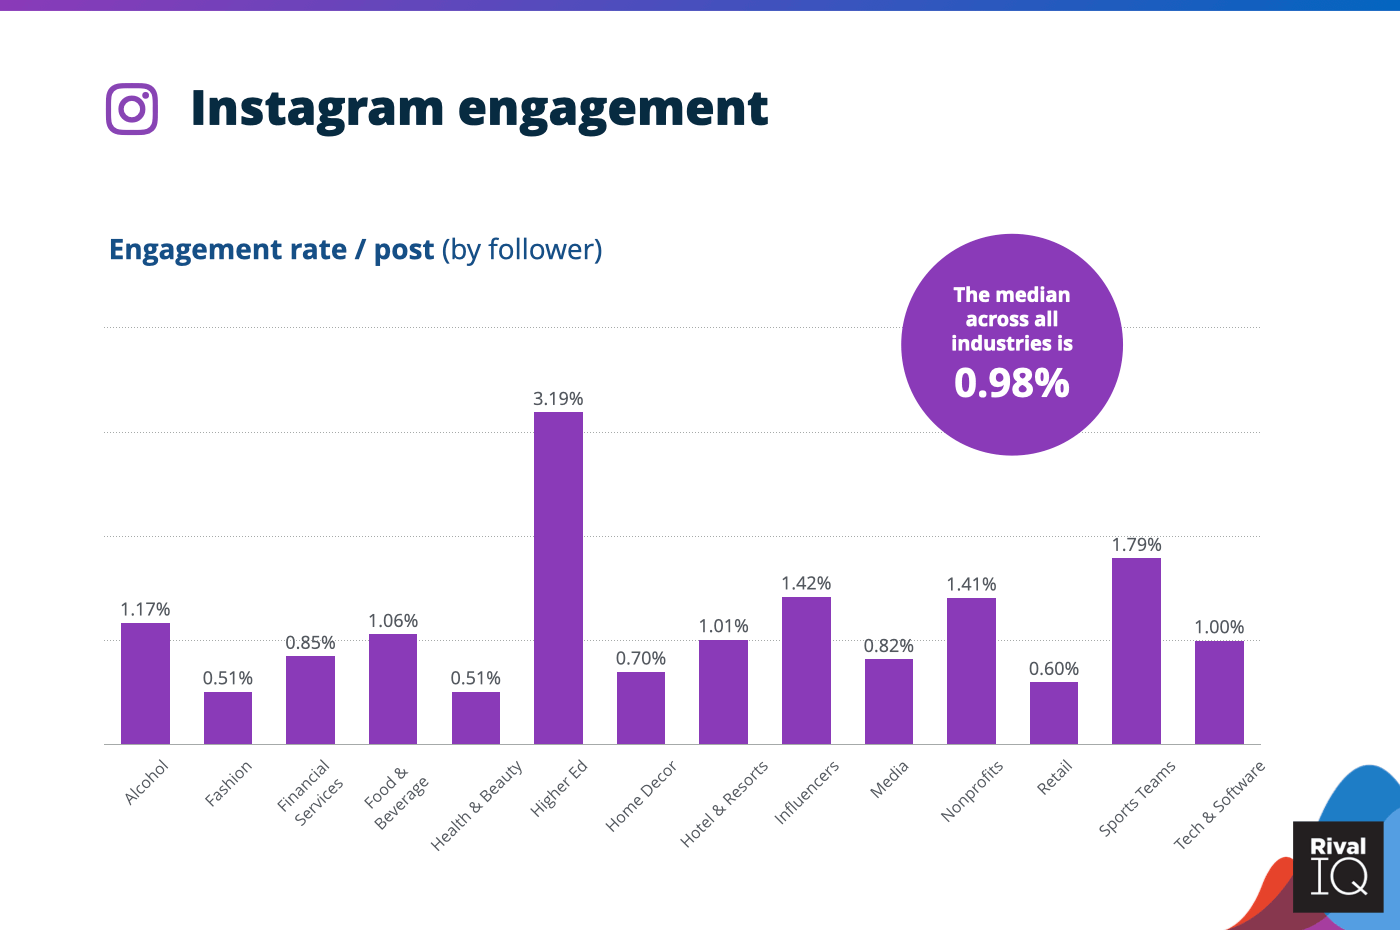
See below the engagement rate benchmarks for 2021.
Our software automatically calculates the Engagement rates for the influencers that are looking to work with you via Social Cat on an ongoing basis
Audience Growth
Growing your social media presence is essential as it will pay dividends in the long run—more on that in another guide.
While there is no specific method to measure audience growth, you can have a good idea of this metric when tapping into your insights on Instagram:
Your Instagram Profile → Tap on the three lines - up right corner - Insights - Your Audience
You can filter this data by a specific date when a campaign went live, let's say. Then, when you promote to the right audience, you should see a spike in the number of followers, depending on how many followers the influencer has.
How to track the metrics for your campaign
Now that we know more about the metrics, we need to understand how we track them. By having a tracking system in place, we can better understand which influencers and audiences perform better.
We tested different tracking of Influencer Campaigns, but we recommend tracking via discount codes as this is the easiest and the most accurate one.
Tracking via discount code
Tracking via discount code offers two significant advantages:
- Attribute conversions to a specific influencer or campaign
- Provides an extra incentive for an audience to tap into your product
Platforms like Shopify, Etsy, or payment providers like Stripe or Square provide this feature to their customers, making it easy to set up.
Would you like to get started with influencer marketing? Start a free trial with Social Cat and collaborate with micro-influencers to get sales, brand awareness and user-generated content.
